

Five of nine sectors moved higher on Wednesday, XLB, XLY and XLI were the strongest sectors.
Money Flow
Euro -112 pips 1.2936
TNX +0.35 19.95
TLT -1.42 118.01
XLF -0.04 13.34
SPX +0.24 1,277.06
VIX -0.75 22.22
NDX +0.33%
INDU +0.17%
SPX +0.02%
COMPQ -0.01%
RUT -0.66%
Money Flow followed the Euro lower early, but reversed around 10:45 as bonds fell and TNX, XLF and SPX moved higher from mid-morning lows.
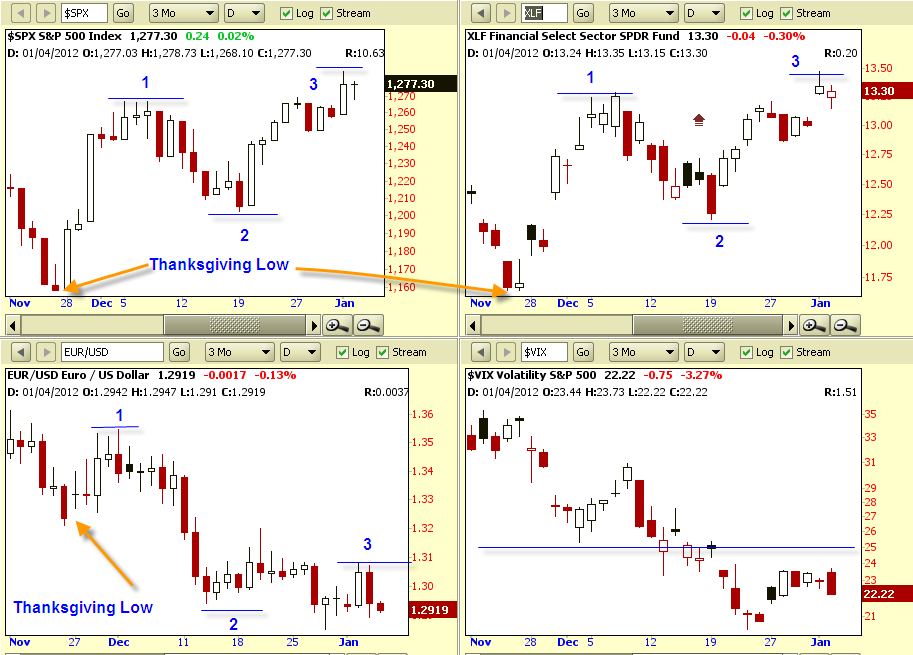
Chart Signals has been pointing out since early December the divergence between the Euro which has gone to new lows since its Thanksgiving week low and the SPX and XLF which have made higher lows and higher highs since their Thanksgiving lows. The VIX fell confirming the slight rise in the SPX. The VIX reversing its early morning rise is another confirmation that big money is not looking at the Euro trading as the primary causal factor in U.S. stocks at this time.
Weight of the evidence - If you have listened to me for any length of time you likely have heard me make reference to weight of the technical evidence dozens, if not hundreds of times. I had an interaction with an experienced technician recently who was sharing observations that were factually inaccurate based on his own guidelines. I’m not talking about opinions. I am referring to a technical conclusion that was exactly opposite of the primary mathematical fact he stated that his conclusions were based upon. How does this happen? It happens by taking a shortcut, by looking at one indicator, by failing to understand the nuances and limitations of the mathematics of calculated indicators and as a result creating a scotoma or blind spot in your technical vision. I will elaborate on this incidence in a future post. Please don’t put yourself at odds with reality and draw a broad technical conclusion based on a single technical thread and spit into the wind. Click Jim below...
Tuesday’s broad rally turned into Wednesday’s broad pause as the SPX made a return move to its horizontal resistance, theoretically new support at 1,267 and bounced. A classic return move bounce. The mid-October breakout chart target of 1,363 still appears probable although not within the originally expected time frame. Tuesday’s breakout creates a new chart target of 1,332.
(click image to enlarge)
SPY moved up 20 cents on volume of 126.9 million shares which was above last week’s light holiday daily volume. I teach that ideally we like to see trend movement with average to above average volume and pullbacks with average to lighter volume. Today was a classic bullish pullback on 1/3 lighter volume than Tuesday’s big SPY rise.
Breadth weakened as decliners led advancers 1.04 to 1 on the NYSE and 1.58 to 1 on the NASDAQ.
Exchange NYSE NASDAQ
Advancers 1,479 970
Decliners 1,548 1,536
AAPL, GOOG and QCOM moved higher. AMZN, BIDU and PCLN moved lower. The SPX breakout supported by breakouts in key NDX stocks AAPL and GOOG is another classic confirmation.
Did you heed our post this morning at 9:55 before the mid-morning low in the SPX? If so, you should be smiling still… “9:55 am ET - DE, F, CMG breakout of resistance...X, AKS, CF, CLF on the rise...ANR, CAT rebounding from lower open...”
Apparently Jim gave heed, click here: http://www.youtube.com/watch?v=YQrTGE4wwwA
Leading stocks > +2% on Wednesday DECK, CROX, ZAGG, RVBD, AKS,HAL , IL , CF, COH, TBT, ZION
Apparently Jim gave heed, click here: http://www.youtube.com/watch?v=YQrTGE4wwwA
Leading stocks > +2% on Wednesday DECK, CROX, ZAGG, RVBD, AKS,
Losing stocks < -2.0% included FAZ, GRPN, ESI, SNDK, ARUN
NDX 100 stocks stronger than the NDX included NFLX, MU, NUAN, WFM, MSFT, STX, INTC, SBUX, CSCO and APOL.
Stocks weaker than the NDX include EA, EBAY, YHOO, NTAP, FSLR, RIMM, GMCR, VMED, CHKP and EXPE.
Three NDX stocks CTSH, MAT, and ORLY
Stocks to Watch on Thursday
Holding Above 30 DMA = 51
V, WDC, LDK, DLR, CSTR, IL, URE, GES, CMG, DE, DOW, ENTR, FAS, HUM, SWK, UNP, F, NKE, UCO, ATI, CIEN, CRUS, SMH, SWKS, ZION, JDSU, NGLS, AKS, BAC, CF, CHL, DHR, STI, HAL, SOHU, X, A, ANR, C, CAT, CLF, CROX, FCX, GS, JNPR, LVS, MOS, PCX, POT, RCL, TPX
Moving Above 30 DMA = 4
COH, ESI, RVBD, TBT
Moving Below 30 DMA = 5
ANF, IBM, NDAQ, TLT, TSL
Staying Below 30 DMA
ICE, SNDK, GRPN, FFIV, NTES, FAZ, CDE, NVDA, SLB, TSLA, INFA, CRM, DECK, HLF, VECO, KKD, SLW, GLW, TIF, VMW, ARUN, CREE, SWN, WLT, MCP, SINA, ZAGG, LNKD
Thirteen Week Intermediate Term Market Trend: Up
Short Term Market Trend: Up

3 comments:
Dave:
Thanks so much for the comments and insights.
Robert
CANI_212
Enjoyed the JC tune and your guidance as always!
Thanks Dave.
Mike
Dave:
This is the first time I came to your blogspot. I like what I see. Truly enjoyed your sessions today - specially the morning Trading Room - ITS.
You are the real deal, authentic and passionate to help others learn the craft.
Happy and Prosperous 2012.
Sam Roy
Post a Comment