The SPX formed large black candle and closed -15.90 at 1,317.37, with price reaching an intraday low at 1,312 near its price channel support. The SPX is in a three week consolidation downward sloping price channel or complex flag which indicates a potential price target around 1,310. Look for a potential support bounce in this area although some smaller range bullish candle may appear on Tuesday before a bounce might begin. Also stayed prepared for a break of support.
The SPY price channel indicates a potential price target around 131 and made an intraday low at 131.59 before bouncing and forming a doji. Potential support bounce entry would be above 132.46. The VIX opened higher and closed lower than its open forming a black candle.
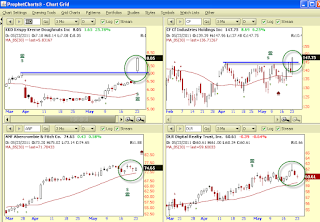
KKD +25.78% gaining +1.25 after reporting strong revenues and earnings as people ate more donuts than analysts expected. Could this be the reason for Monday’s selloff?
(click image to enlarge)
SPX large black candle, close below 30 DMA -1.19%
INDU large black candle, close below 30 DMA -1.05%
COMPQ gap down spinning top, close below 30 DMA -1.58%
RUT gap down large black candle, below 30 DMA -1.81%
Breadth weakened as decliners led advancers 3.89 to 1 on the NYSE and 4.29 to 1 on the NASDAQ …
Exchange NYSE NASDAQ
Advancers 616 496
Decliners 2,400 2,130
Index Chg. Close Direction Confirmation
VIX +0.84 18.27 Up Yes – SPX
SOX -9.22 423.34 Down Yes – COMPQ
Leading stocks > +2% on Monday included KKD, CF, FAZ, POT, MOS, GMCR
Losing stocks < -2.0% included SINA, SOHU, LDK, NTES, UCO, PCX, FWLT, FAS, NETL, LVS, JEC, JDSU, A, JNPR, TSL, MCP, SWK, SWKS, ATW, STI, GES, CAM, GLW, CAT, ESI, NDAQ, URE
Positives – NFLX, VIX black candle, TNX white candle,
Negatives – SPX, VIX, INDU, COMPQ, RUT, XLF, SOX, breadth and sectors weakened, AMZN, BIDU, GOOG, PCLN, QCOM
Interest rates TNX -0.18 moved lower but closed above their open. Bond ETF TLT moved up 46 cents. The Euro moved down 95 pips to 1.4056 at 5 pm on Monday.
SPX
Resistance: 1,321, 1,330, 1,344
Support: 1,310, 1,300, 1,288
The short term 3 day trend is down.
The six-month trend is up.
The twelve-month trend is up.
Trade with the trend of the chart you are trading.
Bullish entry signal is a bounce off support and a break above the high of the low day or a break out of horizontal resistance.
Bearish entry signal is a break of short term support or a bounce down from the 30 DMA or other resistance.
AAPL -0.82 – large white candle, below 30DMA
AMZN -2.43 – hammer, above 30 DMA
BIDU -5.22 – gap down spinning top, below 30 DMA
GOOG -5.64 – gap down spinning top, below 30 DMA
NFLX +1.93 – white candle at resistance, close above 30 DMA
PCLN -18.42 – gap down large black candle bear flag, below 30 DMA
QCOM -1.00 – hammer, above 30 DMA
NDX 100 stocks stronger than the NDX include SPLS, ORLY
Stocks weaker than the NDX include CTRP, BIDU, INTU, PCLN, DELL, ORCL, WCRX, JOYG, SRCL, MU, ALTR, QGNE, AKAM, XLNX and EBAY.
Stocks to Watch on Tuesday
Holding Above 30 DMA
HUM, HLF, CSTR, ANF, DLR, TIF, TLT, MHS, UNP, VECO, HAS, UAL, GMCR, KKD, RVBD, FAZ, ACN, ICE, CMG, SWN, VMW, CF, CREE, CRM, IAG
Moving Above 30 DMA = 0
Moving Below 30 DMA = 9
A, ATW, DHR, GES, JDSU, JNPR, SMH, SWK, URE
Staying Below 30 DMA
ARUN, STI, V, AMD, ESI, GLW, SNDK, ATI, CIEN, NYX, CHL, DOW, F, NVDA, FWLT, ZION, CAT, IL, NDAQ, SWKS, VLO, WDC, MCP, SINA, WLT, UNG, FAS, LVS, SOHU, UCO, ANR, DE, NETL, NGLS, PCX, AGU, AKS, FCX, IPI, LDK, SLB, TSL, CLF, DECK, NTES, POT, JEC, SLW, GS, CDE, TBT, MOS, X, CAM, BAC, CRUS
Intermediate Term Market Trend: Up
Short Term Market Trend: Down


2 comments:
Love the addition of the potential bounce entry information with the specific number you are looking at. What do you see to come up with 132.46? Is it because that is near the halfway point of yesterdays large trading range?
Thanks.
Thanks again for your analysis and the donuts comment.
Post a Comment